Data has had an elevated role in building management since the era of the Internet of Things began. University building managers have always been tasked with keeping campus facilities running in a cost-efficient and safe manner that is conducive to the learning environments of higher education. What was once a largely manual process of ‘tending to the farm’ is now handled with robust arrays of sensors that feed data into complex building automation and building analytics software.
Analytics from these devices can keep building managers ahead of maintenance, preserve a tight budget, and help you react quickly to any issues with a detailed life model of building performance across campus. The below diagram from a Schneider Electric study illustrates the impactful savings that smart building analytics can offer.
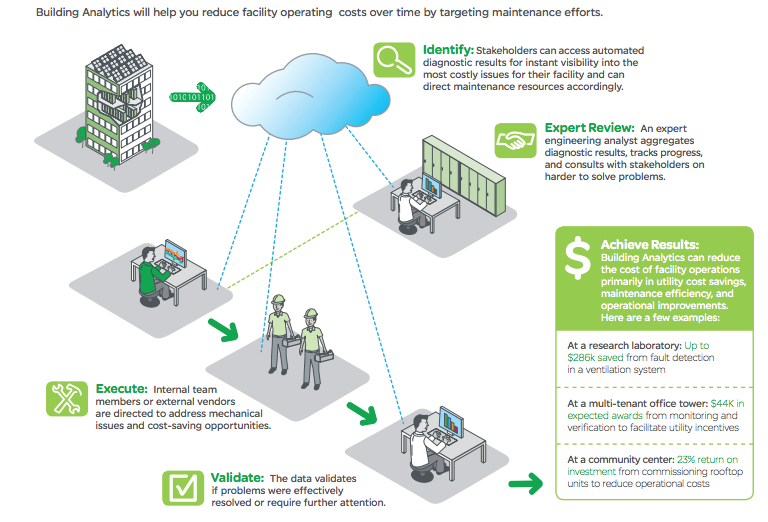
Source: Schneider Electric
Key building analytics metrics tell the story of each structure in real-time, with the historical trends raising red flags when things go wrong or quantifying progress when improvements are realized. FacilitiesNet lays out a total of ten major applications for smart building analytics, including comparing energy use between buildings across a campus, identifying failing or broken equipment, and accurately predicting future expenses.
But what should you be tracking? Pay attention to these key building analytics metrics:
1. Percentage of Space Utilized
People Analytics is an especially important and growing area of building analytics that focuses not on what the equipment is doing, but what the people within the building are doing. Measure the percentage of common space, lab space, lecture hall space, and other types of space that is being actively utilized (and how frequently) to get a clear idea of whether the space is being used to its fullest potential. An auditorium that is always in use may mean an investment in an addition or second space is warranted, whereas one that is chronically empty and unused may mean more opportunities to lease out the space and recoup the costs of keeping it heated, ventilated, lit, and well-maintained.
2. Occupancy Rates
Occupancy rate is another one of many smart building analytics that fit in the category of People Analytics. You can track occupancy behaviors with sensors, beacons, wi-fi triangulation, and other techniques. When you collect data about where users go, how long they stay, and how many are occupying areas within the building can reveal opportunities for leaner asset management, improved user experiences, and other cost reductions. Underused spaces can be optimized in your building automation schedule to reduce their drain on resources, while more heavily or frequently occupied spaces can benefit in return. This is a timely metric, too, with the crowdedness of public spaces now at the forefront of the public consciousness.
3. Total Maintenance Downtime
Metrics around the hours you spend on maintenance can make powerful management KPIs. A “total downtime” metric for equipment or software helps you to understand both the effectiveness of your maintenance strategy and the wait times to expect when planning and coordinating preventative or reactive maintenance outages in the future.
4. Energy Consumption (especially electricity)
Building analytics metrics related to energy use (electricity, water, gas, oil, etc.) is a prime concern for any facility with an eco-friendly agenda, but it’s also about setting goals for efficiency savings and monitoring progress towards those goals. Data on electricity consumption will help you quantify the benefits of implementing LEDs, lighting intelligence technologies, and the effectiveness of new eco-friendly electric systems that are replacing older building systems based around fossil fuels. Your university’s emissions performance and carbon footprint are more relevant in today’s world than ever before. At the same time, setting realistic and attainable targets can help you optimize campus building operations and save on internal costs.
These four metrics are a good place to begin building your facilities management KPI dashboard, but the priorities of your university and the state of your facilities should certainly play a role in picking the metrics that matter most. However, virtually all facilities will benefit from the implementation of People Analytics, which you can learn more about in this insightful Medium article from Daan de Geus.
If you’re looking for a deeper understanding of your building’s automation systems and built-in Internet of Things, contact us at ODIN and our team will be happy to help!